Production scoring
To provide an easy to decipher measure, Workforce Intelligence scores the data for you, assigns a number from 0-10, and color-codes the result, with 10 being the best score you can get.
To calculate a score, Workforce Intelligence compares the actual production hours accumulated by a department or team to its expected hours. The expected hours are compiled based on your associate's time entries. For each shift, associates are prompted to enter their expected start and end times along with time they anticipate spending on lunch and other breaks.
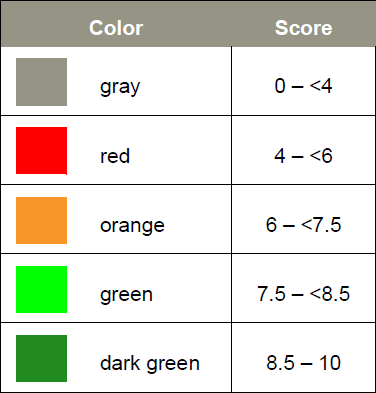
A score of eight (8) indicates the department or team performed exactly as expected. A nine (9) or ten (10) indicates they did better than expected and any score under eight indicates their performance was less than expected. For instance, if an associate is 120% or better the score will be 10. This chart shows how colors are assigned:

The production score is calculated using these formulas, where...
Pa = actual production hours (recorded by Runtime/Agile Desktop)
Pe = expected production hours (calculated by Workforce Intelligence based on the expected hours entered by the associate)
If |
Then this is how the score is assigned |
Pe = 0 |
No score is assigned. |
Pa = Pe |
A score of 8 is assigned. |
Pa < Pe |
The score is calculated with this formula: 8 * Pa/Pe |
Pa > Pe |
The score is calculated with one of these formulas:
|
