Daily Time chart
By default, Workforce Intelligence shows activity in a 12-hour, shift-based window. You can change this view using the Shift and Day buttons.
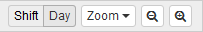
You can also click Zoom to zoom in or out to a specific setting or click the magnifying glass icons to zoom incrementally.
Click |
To see the data... |
Shift |
Based on the shift the associate defined on the Entered Expected Hours window. |
Day |
Relative to a 24-hour, midnight to midnight, day. Keep in mind that if a shift extends past midnight, say from 10pm to 6am, two hours will appear on the first day and six hours will appear on the second day. |
Zoom |
In various time intervals, from 15 minutes to 24 hours. |
Note: Data is always reported based on the day the shift starts.
Keep the following in mind...
If you click an application in the Application chart, the Daily Time chart updates to only show when the associate used that application. Click the application again to unselect it or simply click another application. You can also click the Clear Selected App button in the Daily Time chart to see all application data.
If you click an item within the Daily Time chart, the application chart updates accordingly. You can click the Clear Selected App button in the Daily Time chart to see all application data.
You can click and drag within the chart and all other charts will update accordingly.
The start and end times for the shift are centered within the 12-hour window and are indicated by a gray bar. You can hover over an associate's name and see that associate's score, production hours, and expected hours.
