Workflow Summary (table view)
You can view a list of of bounded and task-based workflows by using the table view of the Workflows Summary. You can see the top 250 workflows. The system selects these workflows based on the overall score of the workflows.
Viewing workflow data from the Workflow Summary table view
You can view all data associated with workflows in table, and then sort the data by the columns of most interest to you.
-
From the menu, click Analysis > Workflows.
-
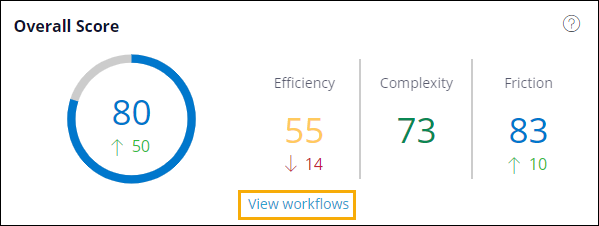
In the Scores section of the dashboard view, click View workflows.
-
Review the data in the table. For each workflow, the system shows you the following information:
Overall score: Provides the overall health of the workflow, based on the Efficiency, Complexity, and Friction scores of all paths in the workflow along with other criteria. This score is a weighted average that helps you determine which workflows might require more analysis.
Efficiency score: Indicates the amount of waste in a workflow. This score compares production and other work time to total time.
Complexity score: Shows the variability that is required to complete a workflow, including total applications and screens, unique applications and screens, and number of steps in a workflow.
Friction score: Notes how much interaction is needed to complete a step or workflow. This score is based on the number of steps, key presses, clicks, and scrolls in a workflow.
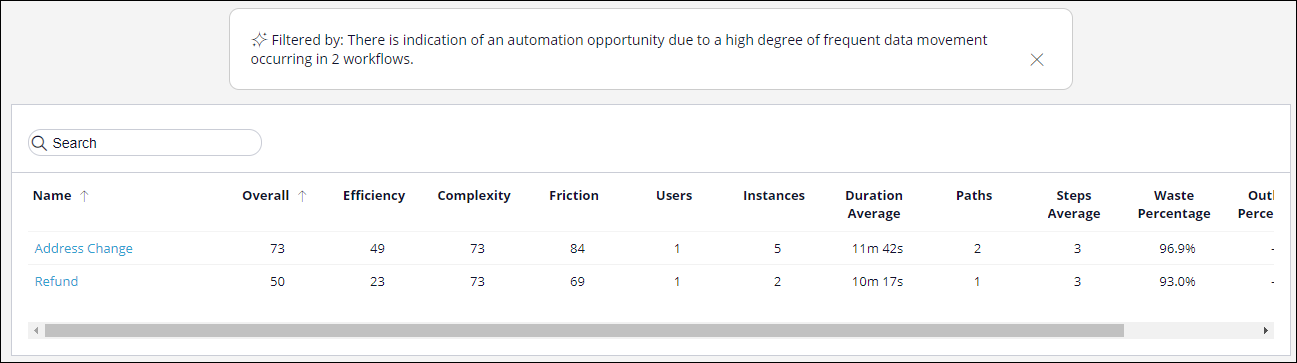
Number of users and the number of instances, or times, that a workflow occurred. For example, if you have 1000 users and 50,000 instances, then each user averaged roughly 50 instances of the workflow. The system also lists the average duration for each workflow instance.
Paths: The number of unique paths in the workflow. For example, a path might involve step A, step B, and step E. Another path might involve step A, step D, and step F.
Steps Average: The average number of steps in each path.
Waste Percentage: The percentage of time spent in one or more of the following categories: Non Work, Unknown, Wait Time, and Idle. For more information, see Waste.
The table also includes information about the percentage of time spent in Microsoft Outlook and Excel. If you would like to add another application, contact your Workforce Intelligence support representative. -
Click any column heading to sort the table by that column.
-
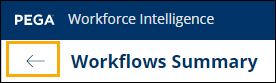
To return to the dashboard view, click the arrow in the top-left corner of the screen.
 ,
,
Filtering the table view by an insight
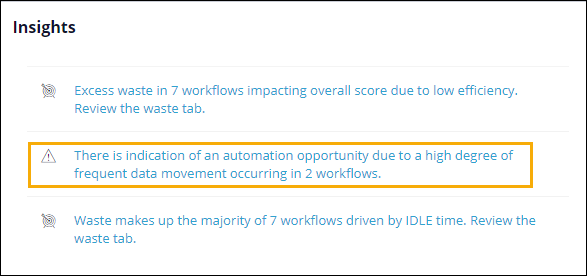
Insight filters can help you focus on the workflows that you want to improve. Complete the following steps to filter the table to only show workflows that meet the criteria for specific insights.
-
From the menu, click Analysis > Workflows.
-
In the Insights section of the dashboard view, click an insight to display a filtered table that only shows workflows that are applicable to the insight.
When the table view is displayed, it is filtered by the insight you selected. The selected filter is also displayed above the table.
-
Optional: To remove the filter from the table, click the X in the bottom-left corner of the filter description.
-
Click on a workflow to access more details associated with the workflow.
Searching for a workflow
Click the Search field and enter the name of a workflow to locate a specific workflow. The system searches all workflows, not just the 250 that the system initially selected.
Changing the date range
The workflow information is shown for a specific date range. To change the date range, perform the following steps:
-
Click the displayed date range.
-
Select the new date range or specify a custom range by clicking the new begin and end dates on the calendar.
-
Click Apply.
Changing the business unit
To view workflow information for a different business unit, click the Hierarchy icon and select another business unit in your organization's hierarchy.
Viewing details
From the list of workflows, under the Name column, click a workflow to go to the Workflow Details page and gain the following information:
-
Monitor specific application usage within a workflow.
-
Identify steps based on the production or other work applications and screens.
-
View contributors to waste at the workflow and step level.
-
View user behavior at the workflow and step level.
-
Compare path variations.
