Workflow Details page
On the Workflow table page or the Workflow dashboard page, click a workflow in the Name column to display detailed information about that workflow on the Workflow Details page. The Overview tab is selected by default. Click the following tabs to see additional information:
-
Paths
-
Waste
-
Users
-
Applications
Reviewing the workflow overview
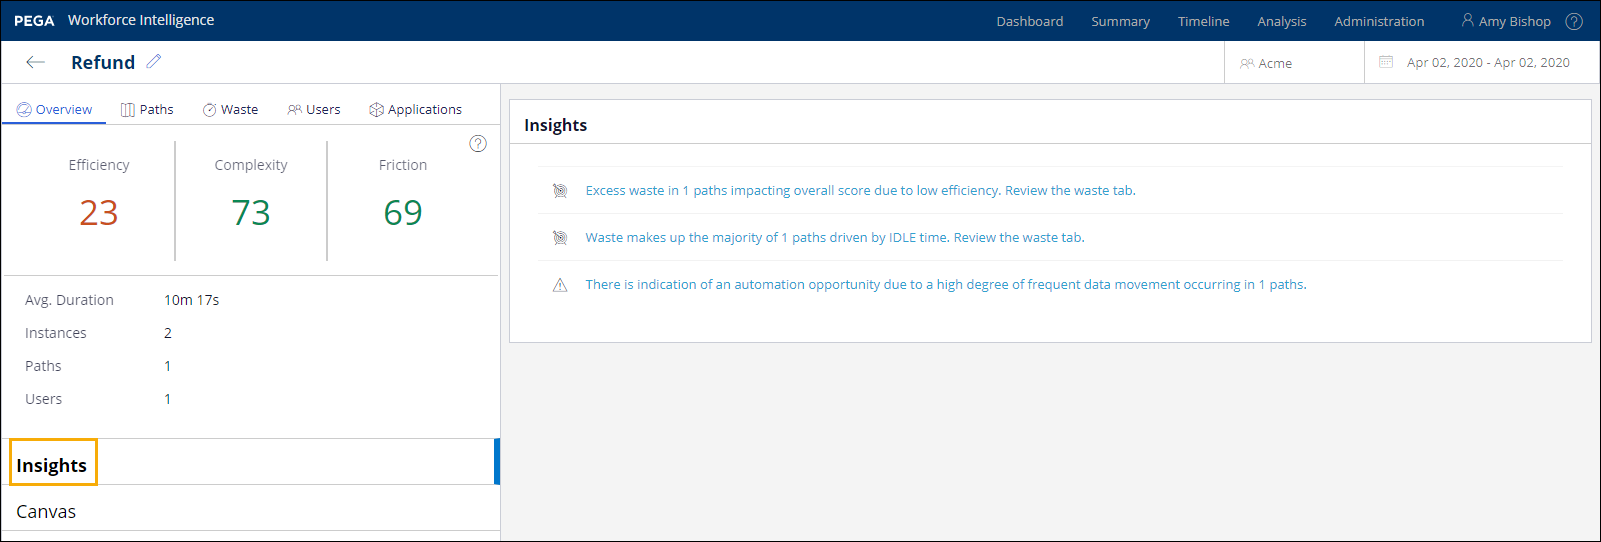
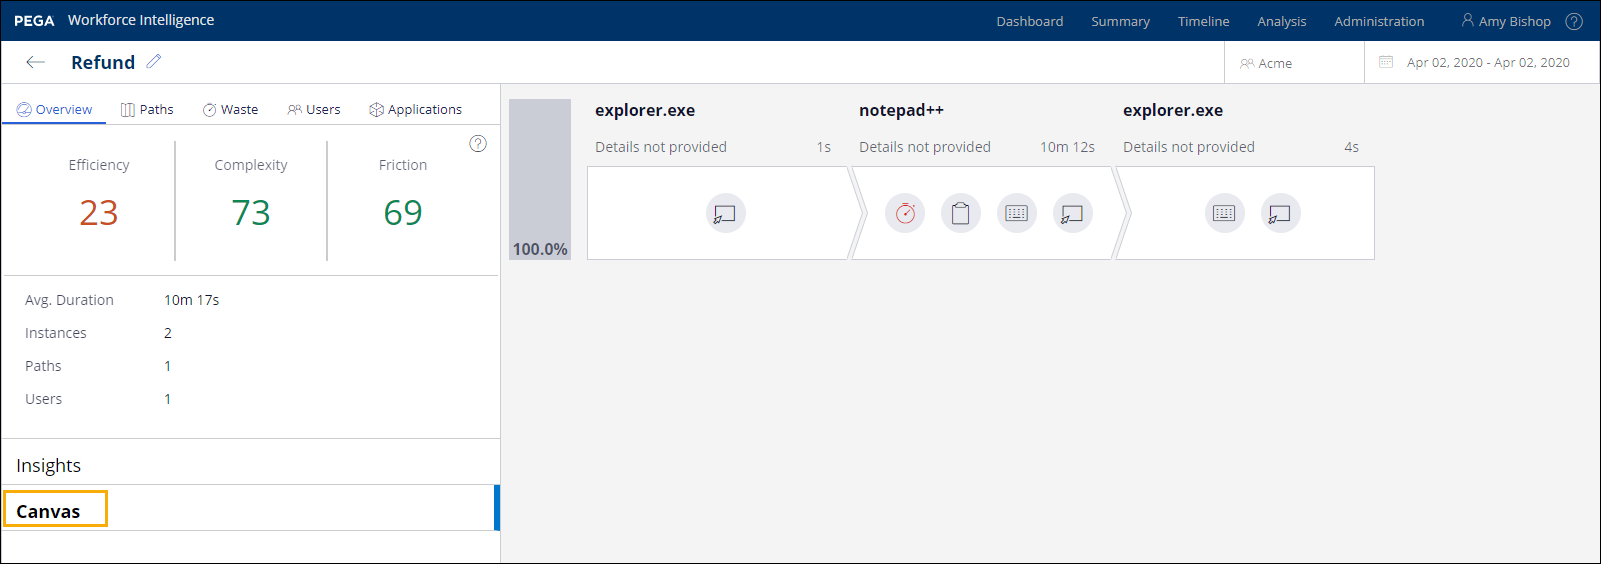
The Overview tab displays scores for the workflow and other details, including average duration of the workflow, number of instances, number of paths, and users. In addition, any insights associated with the workflow are displayed on the right side of the page. The following is an example:
Filtering paths by insight
Insights alert you to ways in which you can improve workflows and paths by highlighting certain events that are happening in workflows or paths or both. When viewing a specific workflow, you can filter the list of associated paths by insight to focus on specific areas for improvement.
-
From the left pane of the Overview tab, click Insights.
-
From the list of insights on the right-side of the page, click a specific insight.
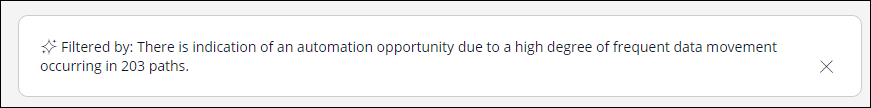
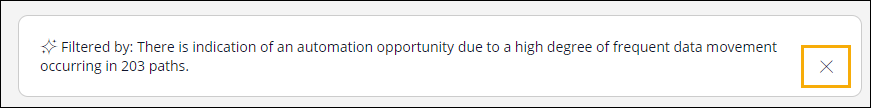
The Canvas displays the paths associated with the specific insight you clicked. The insight filter applied to the list is displayed at the top of the page. You can see the total number of paths included in the filter in this message.
-
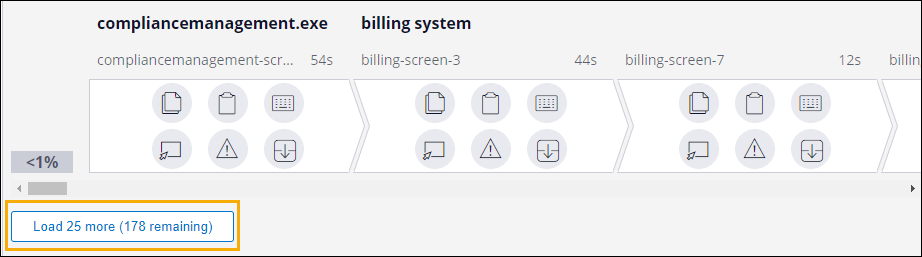
Initially, up to 25 paths are displayed, with the most frequently occurring paths listed first. If the insight filter returns more than 25 paths, you can click Load 25 more at the bottom of the list to add the next 25 paths to the list.
-
If needed, continue to click the Load 25 more button at the bottom of the page to expand the number of paths displayed in the Canvas.
Note: If you load all paths, then the Load 25 more button is no longer displayed at the bottom of the page. -
If you want to remove the filter and display only the most frequent path associated with the workflow, click the X on the right side of the filter message.
Viewing the workflow canvas
-
From the left pane of the Overview tab, click Canvas.
Each step in the workflow is shown in a separate chevron. The following is an example:
Note: For longer paths, the system displays a scroll bar so you can move through the steps. A workflow can consist of as few as two steps and as many as two thousand. -
Hover over the icons in each step to see additional information, such as the average number of paste actions or the average number of mouse clicks that occurred during that step.
The following icons appear on the Workflow Details page:
Icon Description 
Hover over this icon for additional information about the waste.The Waste icon is highlighted in red. 
Hover over this icon to see the average number of cut and copy actions that occurred. 
Hover over this icon to see the average number of key press actions that occurred. 
Hover over this icon to see the average number of mouse clicks that occurred. 
Hover over this icon to see the average number of error key press actions that occurred. 
Hover over this icon to see the average number of paste actions that occurred. 
Hover over this icon to see the average number of scroll actions that occurred.
Displaying path details
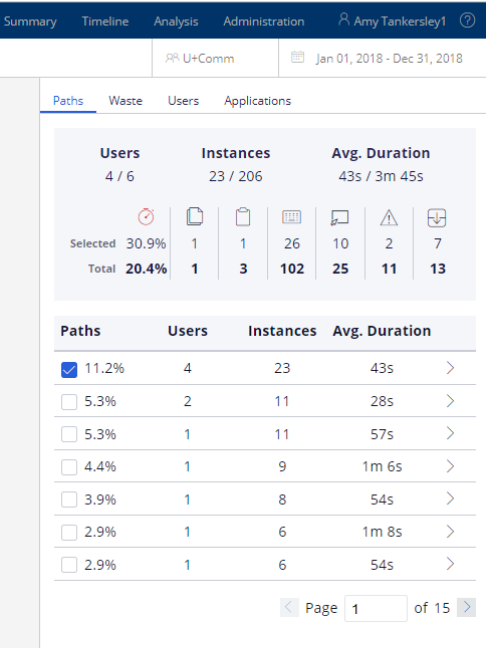
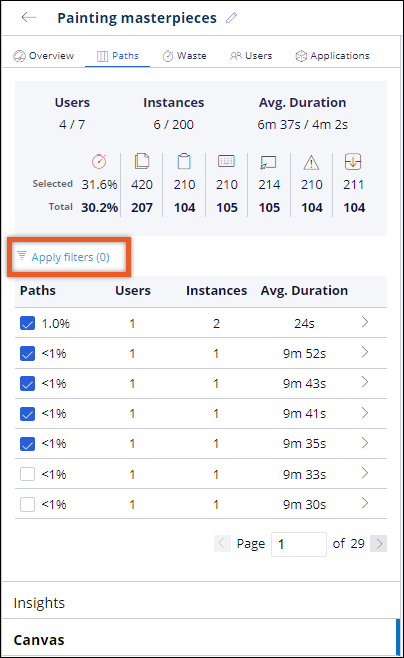
After you click Paths, the system lists each path for the workflow and shows additional details about that workflow on the right side of the page. The following is an example:
Click the check box for a path to display the path in the left panel and show details about that path in the right panel. You can select multiple paths.
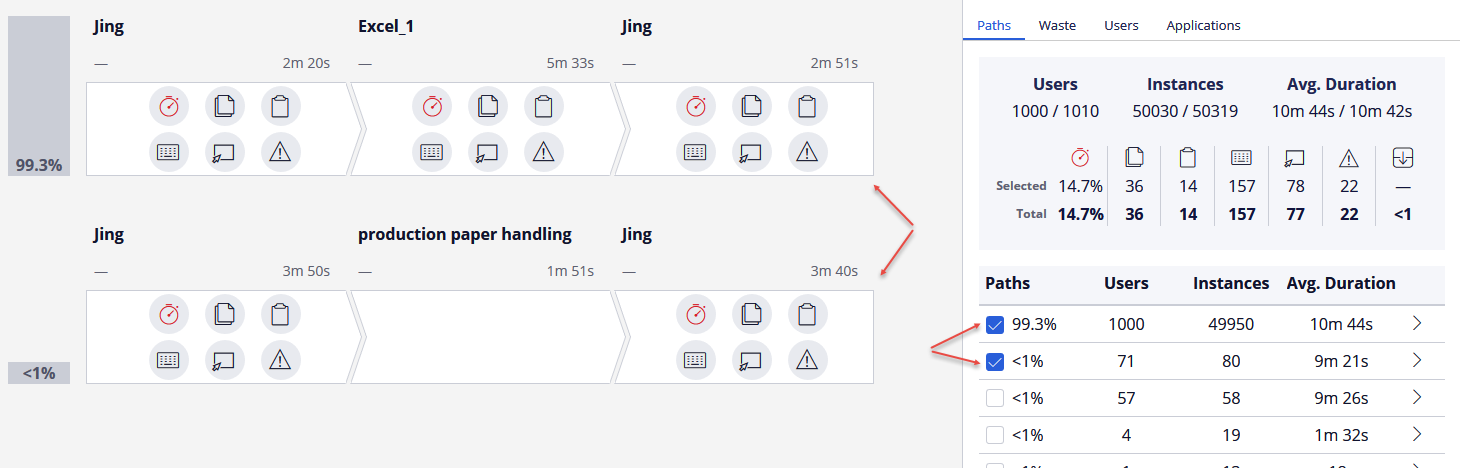
Hover over the icons to see more specific information for that path. Note that the totals at the top of the right panel change, depending on the paths that you have selected. Click a check box again to remove a path from the display.
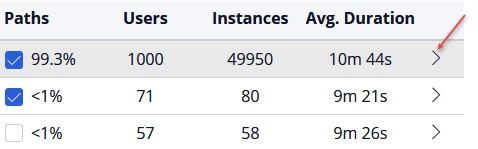
For each path, the system shows you the percentage that it was used in the workflow, the number of users who followed that path, the number of times the users followed that path, and the average time spent following that path. To see additional details about the path, click the > beside a path, as shown in this example:
Additional information displays for each of the icon types, as shown in this example:
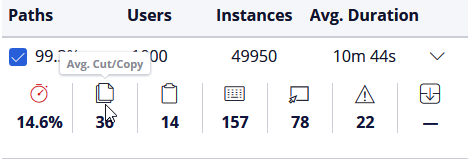
Here you see the waste percentage and the average number of cut or copy actions, paste actions, key presses, mouse clicks, error key presses, and scroll actions.
Filtering paths by applications and screens
When viewing paths for a workflow, paths that meet a default criteria of the top 10% of paths or top 5 paths are automatically selected for you. While you often want to analyze these top paths, you may have other specific criteria you want to find within paths. Apply a custom filter to quickly find other paths of interest within a single workflow.
You can filter by applications and screens accessed, and also by applications and screens not accessed, in paths. For example, if you are promoting the adoption of a new billing feature that replaces a manual process in Notepad, you could create a filter to only show paths that include Notepad and omit the new screen in the billing application to gauge the adoption of the new process.
- From the Paths tab, click Apply filters above the list of paths.
Note: The number in parentheses indicates how many filters are currently applied to the list.
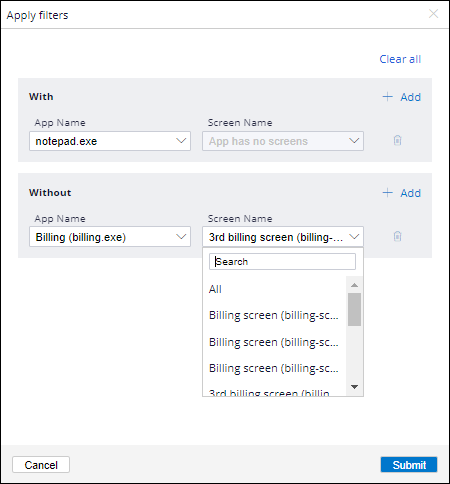
- In the Apply filters pop-up, in the With area, click + Add if you want to include paths that contain a specific application.
- From the App Name drop-down list, enter an application name in the Search field to find and select the specific application you want to include.
Note: The App Name drop-down list includes an alphabetized list of up to 10,000 applications that are part of the workflow that you are analyzing and are also included within the selected business unit and timeframe. All applications and screens that have an alias show both the alias and the application value (executable name) in the drop-down list. If an application does not have an alias, then the list shows the application value only, such as notepad.exe and google.exe. - From the Screen Name drop-down list, select All to include all screens, or enter a screen name in the Search field to find and select the specific screen you want to include.
Note: The Screen Name list is an alphabetized list of up to 10,000 screens that are associated with the selected application, part of the workflow that you are analyzing, and also included within the selected business unit and timeframe. All screens that have an alias show both the alias and the screen value in the lists. If a screen does not have an alias, then the list shows the screen value. If the Screen Name list shows App has no screens, that means Workforce Intelligence has never encountered a screen for that application. If you think this is an error, then it is possible that the screen is not mapped properly. Contact your system administrator to check the mapping. - If you want to add additional applications and screens to the filter, click the + Add button in the With area and specify the applications and screens.
Note: All filter criteria you add uses AND logic. For example, if you add screens from a scheduling application and screens from a fulfillment application, then the filter only returns paths that contain both of your criteria. - In the Without area, click + Add if you want to exclude paths that contain a specific application.
- Select any applications and screens that you want to exclude from the list of paths. Complete the criteria in the same way as described for the With area.
Note: If you exclude applications and screens, these exclusions are added to the filter using AND logic. For example, if you selected to include a scheduling application and exclude a fulfillment application, then the filter limits the results to only paths that have the scheduling application and also do not have the fulfillment application. - If you need to remove any criteria you added, click the Delete icon for those line items.
- After you have finished building your filter, click Submit.
Result: The list of paths updates to match the filter you applied. Any paths listed that meet the default criteria of the 10% of paths or the top 5 paths remain selected. - Select the specific paths you want to review.
Note: If you change the date or business unit while working with the paths, then your filter selections are cleared. The default filter of the top 10% of paths or the top 5 paths is reapplied based on the new business unit or date.
Displaying waste details
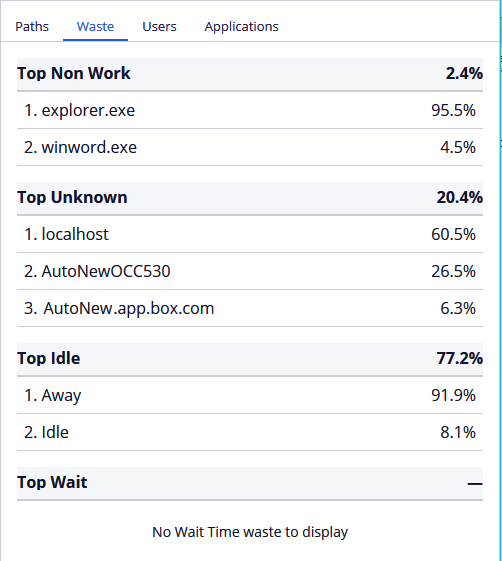
Click the Waste tab to see the top three sources of waste in this workflow for the Non Work, Unknown, Idle, and Wait Time categories. Here is an example that shows waste in Non Work, Idle, and Unknown, but not in Wait Time:
Displaying user details
Click the Users tab to see a list of the top 100 users of this workflow. The system shows you the number of times they performed this workflow and the average amount of time spent performing the workflow.
Displaying application details
Click the Applications tab to see a list of the applications used in this workflow and the percentage of time spent in each application.
Displaying details about a step
Click a step to see additional details in the panel on the right side of the page.
The following is an example that shows the Details tab for the Excel_1 step. This information tells you the total number of users who performed this step, the number of times the step was performed, and the average time spent performing the step.
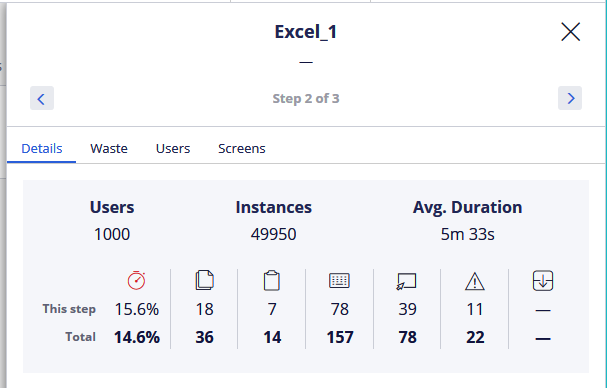
Note: Click the arrows to move through the steps in the path.
Viewing waste details
Click the Waste tab to see the top three waste activities in the following categories: Non work, Unknown, Idle, and Wait Time.
Viewing user details
Click the Users tab to see information about the top 100 users who performed this step, including the number of times each user performed the step and the amount of time it took to perform the step.
Viewing screen details
Click the Screens tab to see information about the top five most frequently used screens for this step and the number of times the screen was accessed.
Returning to the path details
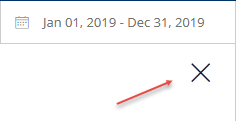
Click the X icon to go back to the path details:
Renaming a workflow
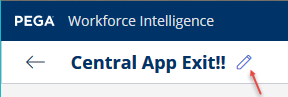
The default name of the workflow is based on the name of the tag that is used or the task data that is sent, depending on the type of workflow. You can, however, change the name to a name more meaningful to you by clicking the Edit icon:
Returning to the workflow dashboard or table view
Click the arrow to go back to the workflow dashboard or table view and select another workflow.