Timeline page
The Timeline page lets you drill down to the respective associates who comprise your departments and teams and compare their performance to other associates, teams, and departments.
After you click Timeline, Workforce Intelligence prompts you to select a team. Your choice filters the data you will see.
You can also change the time period to see desktop usage for any week or month for which you have accumulated data. The top of the page shows you the time period you selected, the score, and the total number of shift hours for that time period.
The Timeline page shows you the following types of charts.
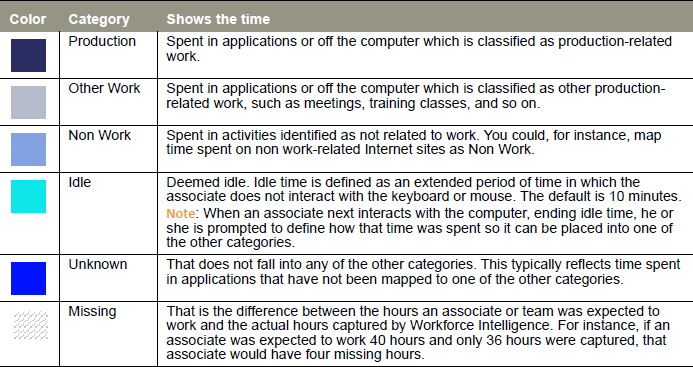
The various reports on this page are color-coded so you can quickly grasp the different categories of activities.
Note: To go to the Summary page, click the breadcrumbs on this page.
