Summary page
This page presents a summarized view of desktop usage that shows where departments, teams, and associates spend their time.
Using the Summary page, you can see when individual associates are on task and engaged in production work, as well as identify when a group or groups of associates are idle or engaged with non-production work. This can help you develop your associates and identify the obstacles that hinder productivity.
Note: To move through your organization, use the breadcrumbs.
You can change the time period to see desktop usage for any week, month, quarter, or year for which you have accumulated data. The top of the page shows you the time period you selected, the score for that time period, and the total number of hours within the shifts captured between the time period you selected.
The Summary page presents the following summaries.
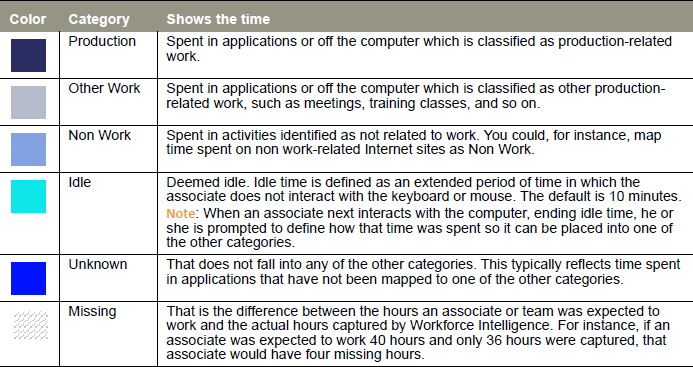
The various summaries on this page are color-coded so you can quickly grasp the different categories of activities.
Note: When you click on any of the graphical elements on this page, all sections of the Summary page are updated to reflect the item you selected. To return to the previous view, click the last selected graphical element.
.
