Workforce Intelligence Dashboard
Use the Workforce Intelligence Dashboard to see an overview of your entire organization. Use the breadcrumbs to move through your organization.
You can change the time period to see desktop usage for any week, month, quarter, or year for which you have accumulated data. The top of the page shows you the time period you selected, the production score of the department or team you selected, and the total number of hours for that time period. The two buttons on the end let you toggle between a percentage or hourly view.
The Dashboard presents the following charts:
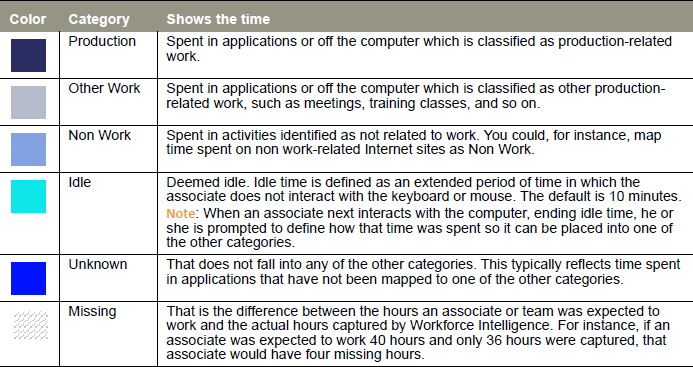
The various charts on this page are color-coded so you can quickly grasp the different categories of activities.